Billing & Reports
Energy Report
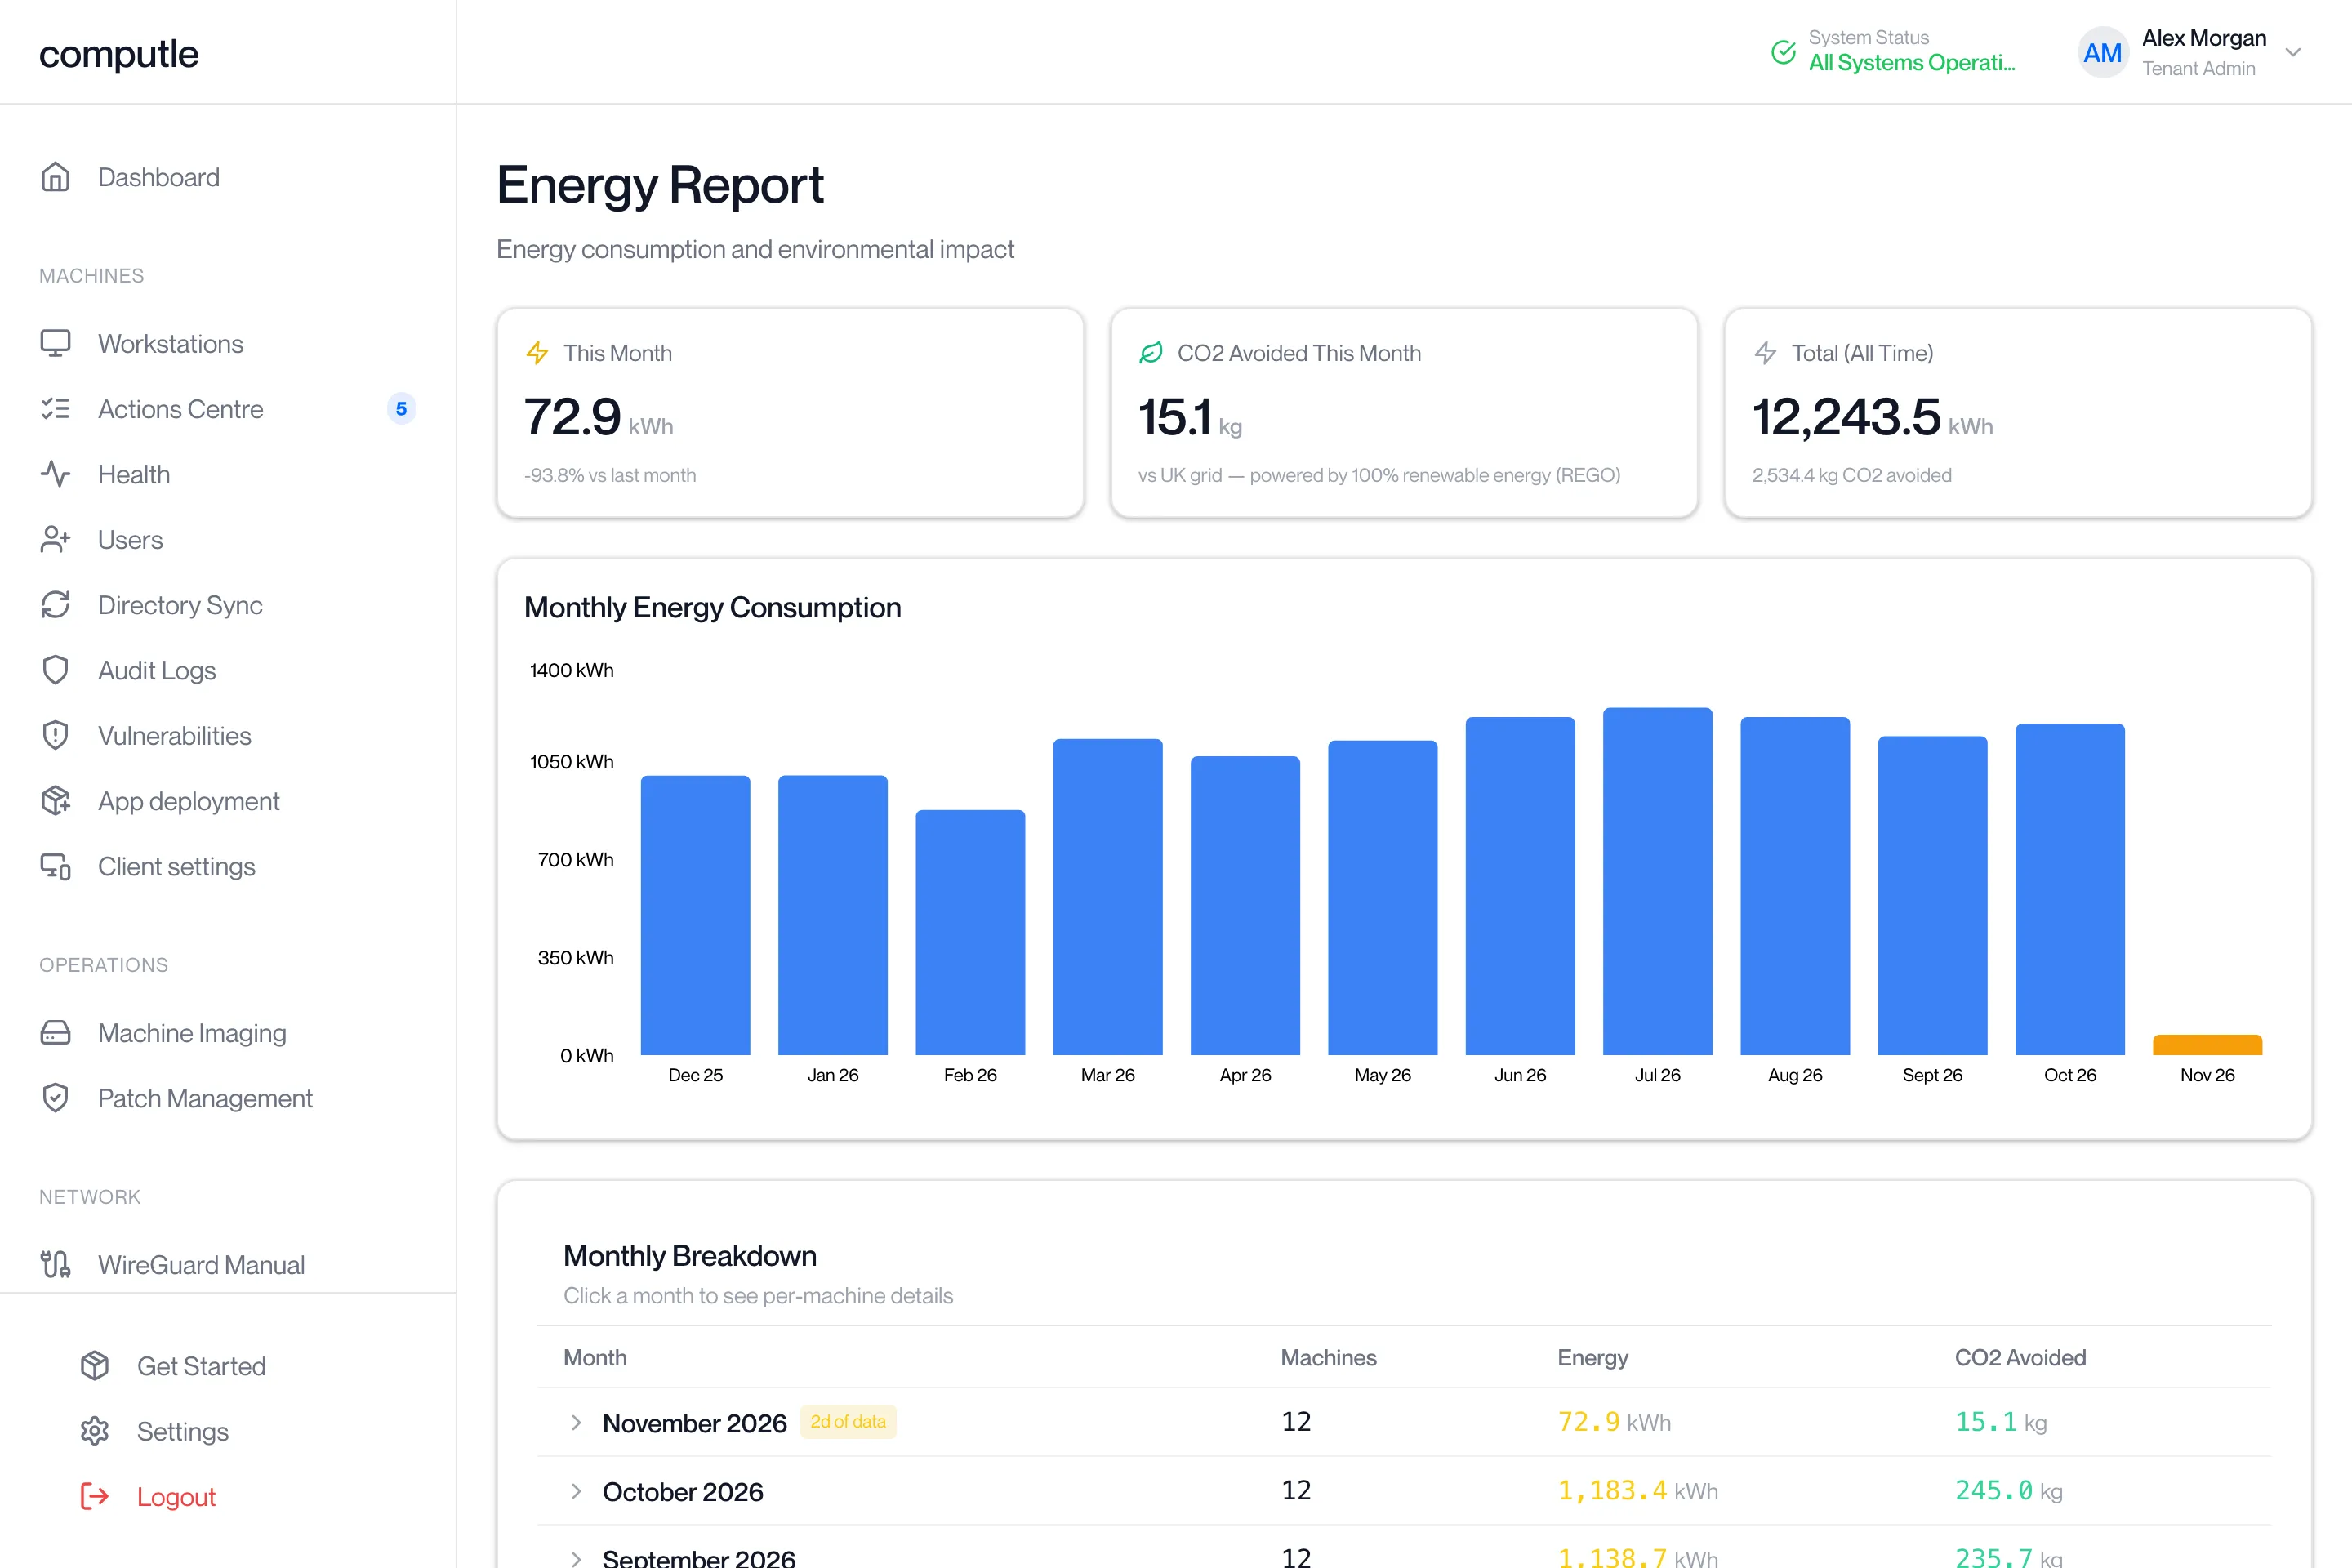
The Energy Report shows how much electricity your workstations used, month by month, and the carbon that would have been emitted had the same electricity come from the UK grid. Use it for sustainability reporting and to see which workstations draw the most power.
Open Energy Report under Monitoring in the portal sidebar. The page needs the Tenant Admin role, and the Monitoring section is shown when Computle has enabled monitoring for your organisation.
How energy is measured
Section titled “How energy is measured”Energy is measured from each workstation’s own power counters, for the processor and the graphics card, over the time the workstation was running. The figure includes power supply losses, the fixed draw of the other components, and the data centre’s cooling at the site where the workstation runs.
Carbon avoided is the energy used multiplied by the UK grid average of 0.207 kg of CO2 per kWh. Computle data centres run on 100% renewable energy, with Renewable Energy Guarantees of Origin, so this is the carbon your organisation did not emit by running the workstations with Computle.
The summary cards
Section titled “The summary cards”| Card | What it shows |
|---|---|
| This Month | Energy used so far this month, in kWh, and the change against last month as a percentage. |
| CO2 Avoided This Month | This month’s energy multiplied by the grid average, in kg. |
| Total (All Time) | Energy used across every month shown, in kWh, and the CO2 avoided in total. |
The page covers the last 12 months.
Monthly Energy Consumption
Section titled “Monthly Energy Consumption”A bar chart of energy used in each month, in kWh. The current month is the last bar and is coloured differently from the rest. Hover a bar for the exact figure.
“No energy data yet” is shown until the first readings arrive.
Monthly Breakdown
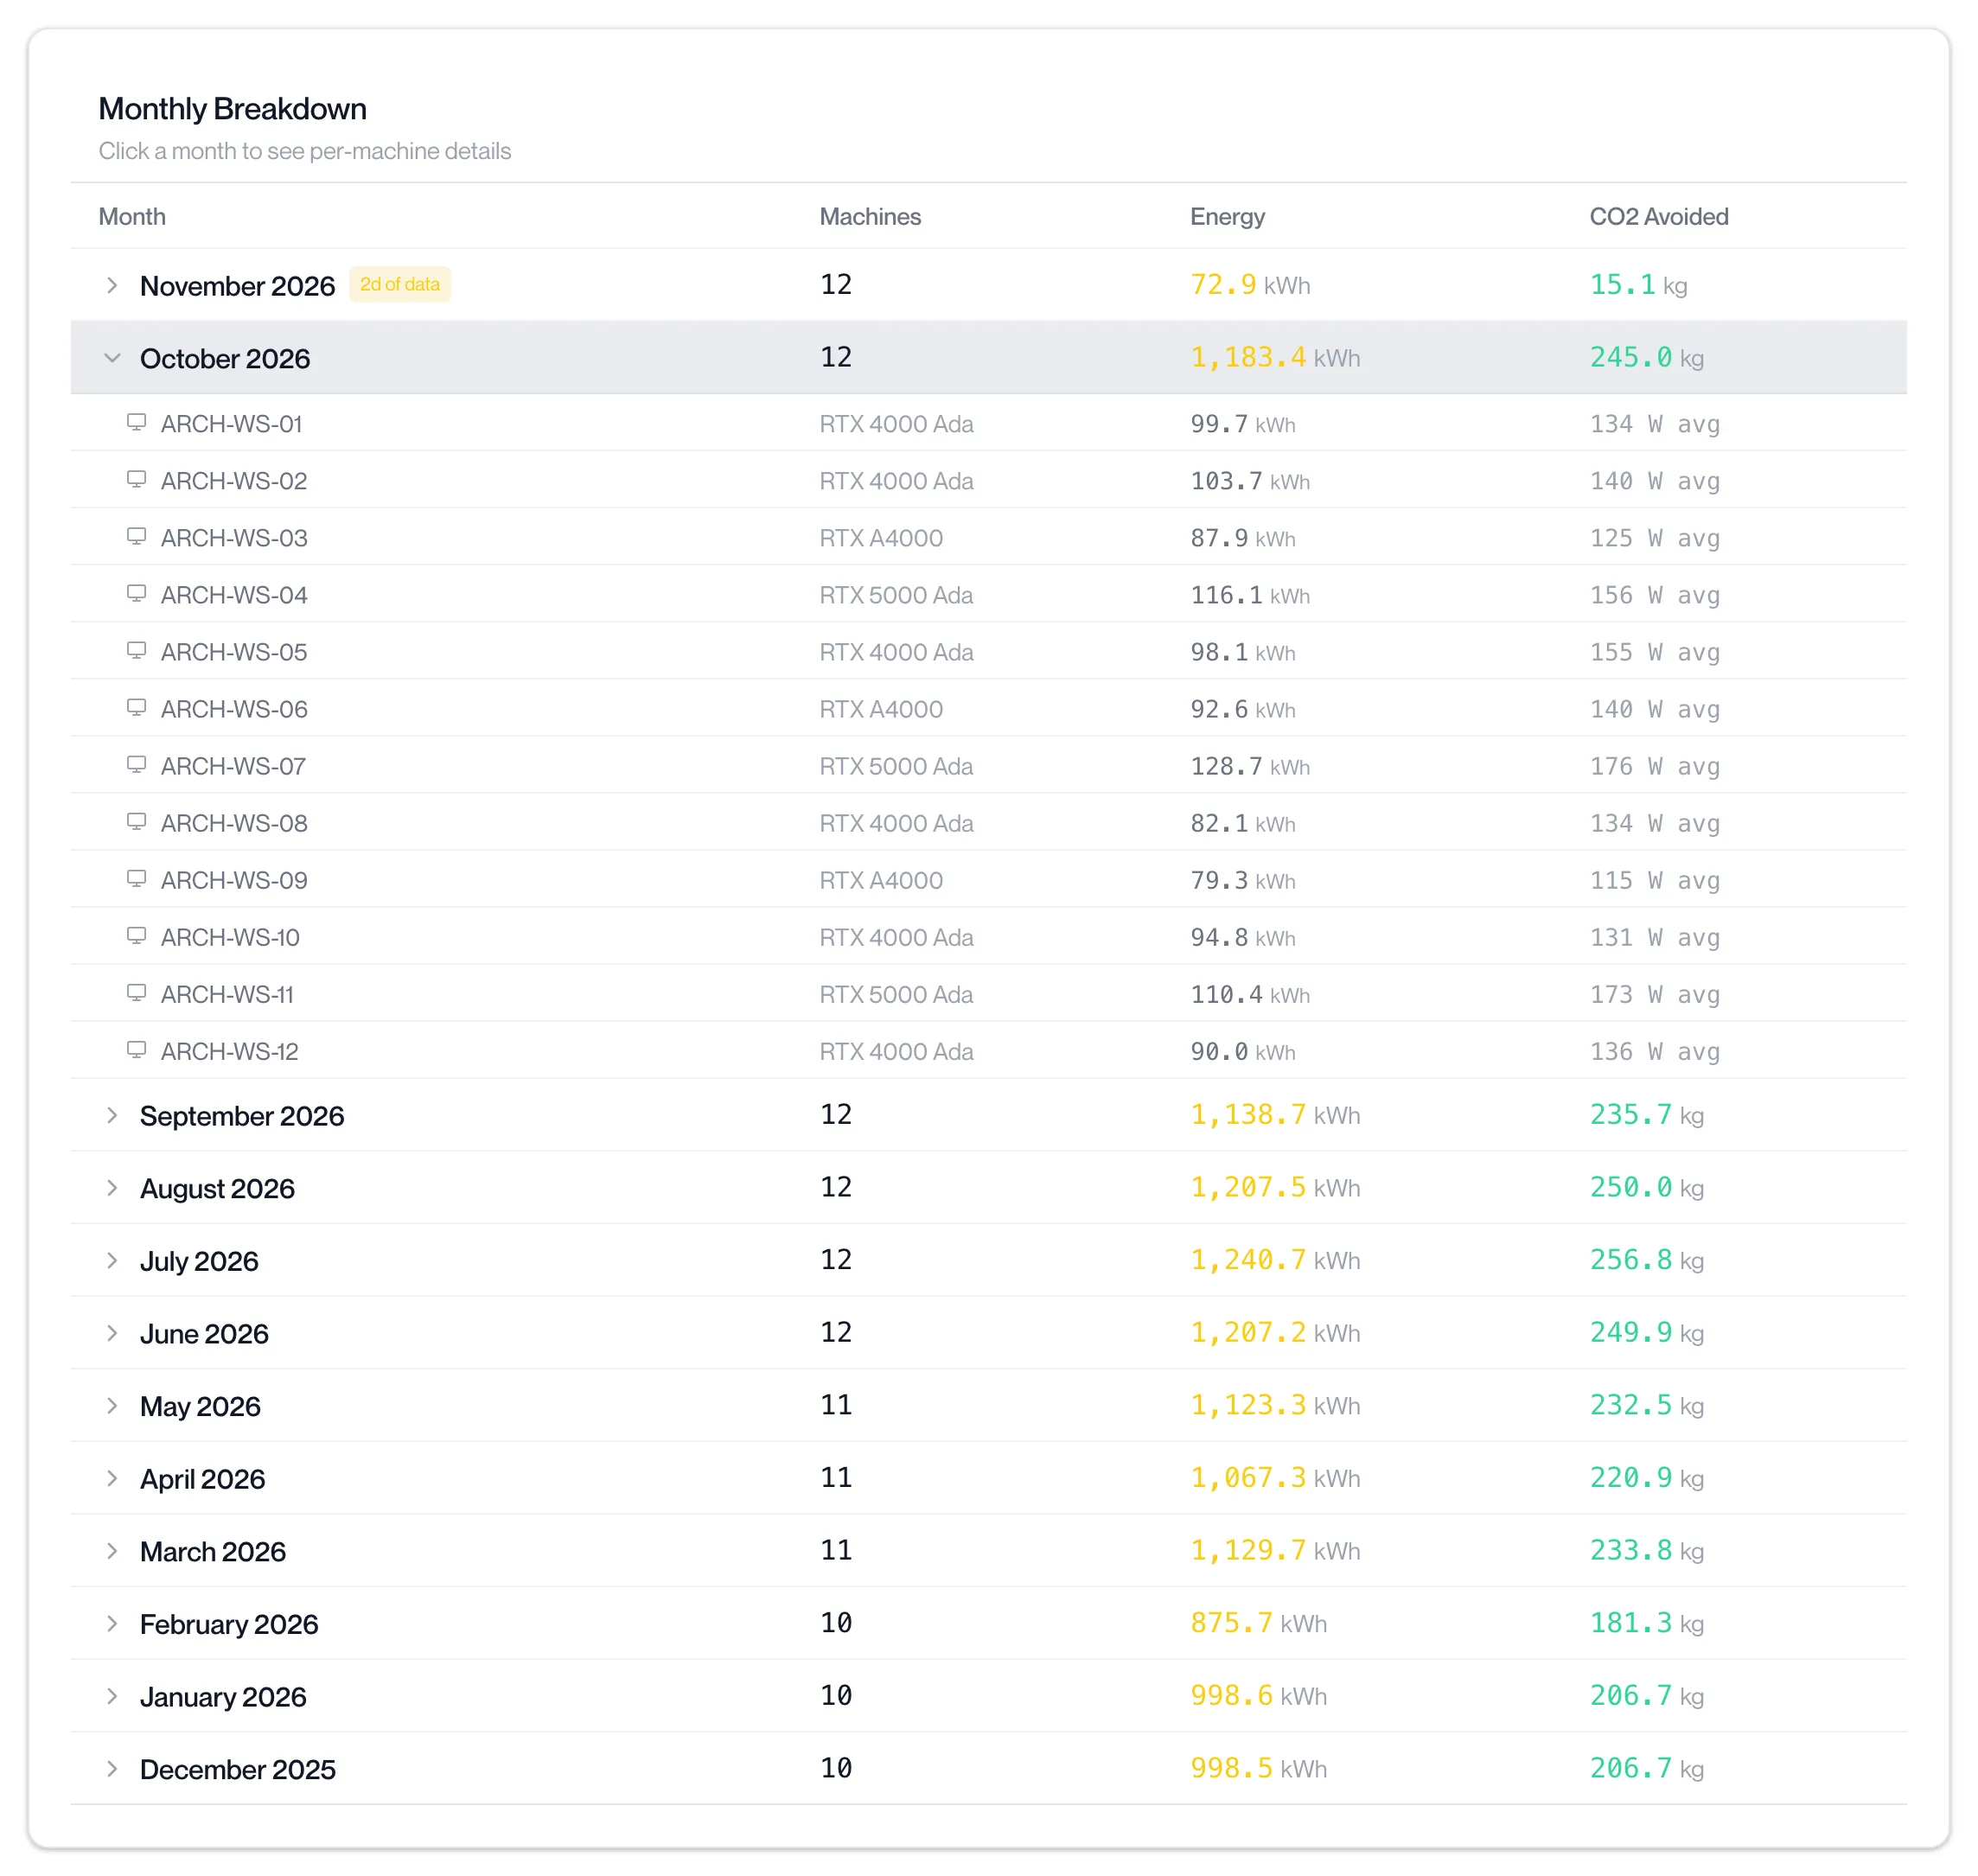
Section titled “Monthly Breakdown”A table with one row per month, newest first.
| Column | What it shows |
|---|---|
| Month | The month. A “…d of data” badge marks a month in which the readings cover fewer days than the month has, for example a month that is still running. |
| Machines | How many workstations reported readings that month. |
| Energy | Energy used that month, in kWh. |
| CO2 Avoided | The energy multiplied by the grid average, in kg. |
Click a month to expand it. Under the month, one row per workstation shows the workstation name, its graphics card, the energy it used that month in kWh, and its average draw in watts.
Related pages
Section titled “Related pages”Questions
Section titled “Questions”Why is a month marked with a number of days?
Section titled “Why is a month marked with a number of days?”The readings for that month cover fewer days than the month has. The current month always shows this until it ends. For a past month it means some workstations were not reporting for part of the month.
Why does a workstation appear by a short code instead of its name?
Section titled “Why does a workstation appear by a short code instead of its name?”The name comes from your workstation list. A workstation that has been removed from the list, or whose readings arrived before it was named, is shown by the first characters of its identifier.
Is the carbon figure what we emitted?
Section titled “Is the carbon figure what we emitted?”No. It is what would have been emitted from the UK grid for the same energy. The workstations run on renewable energy, so it is the carbon avoided.