Workstations
Health
The Health page lists every workstation in your organisation with its guest health state, its live resource figures and any crash dumps it has sent. It is where you look when a user reports that a workstation is slow, has restarted on its own, or cannot be reached.
Open Health in the Machines section of the portal sidebar. The page needs the Tenant Admin role.
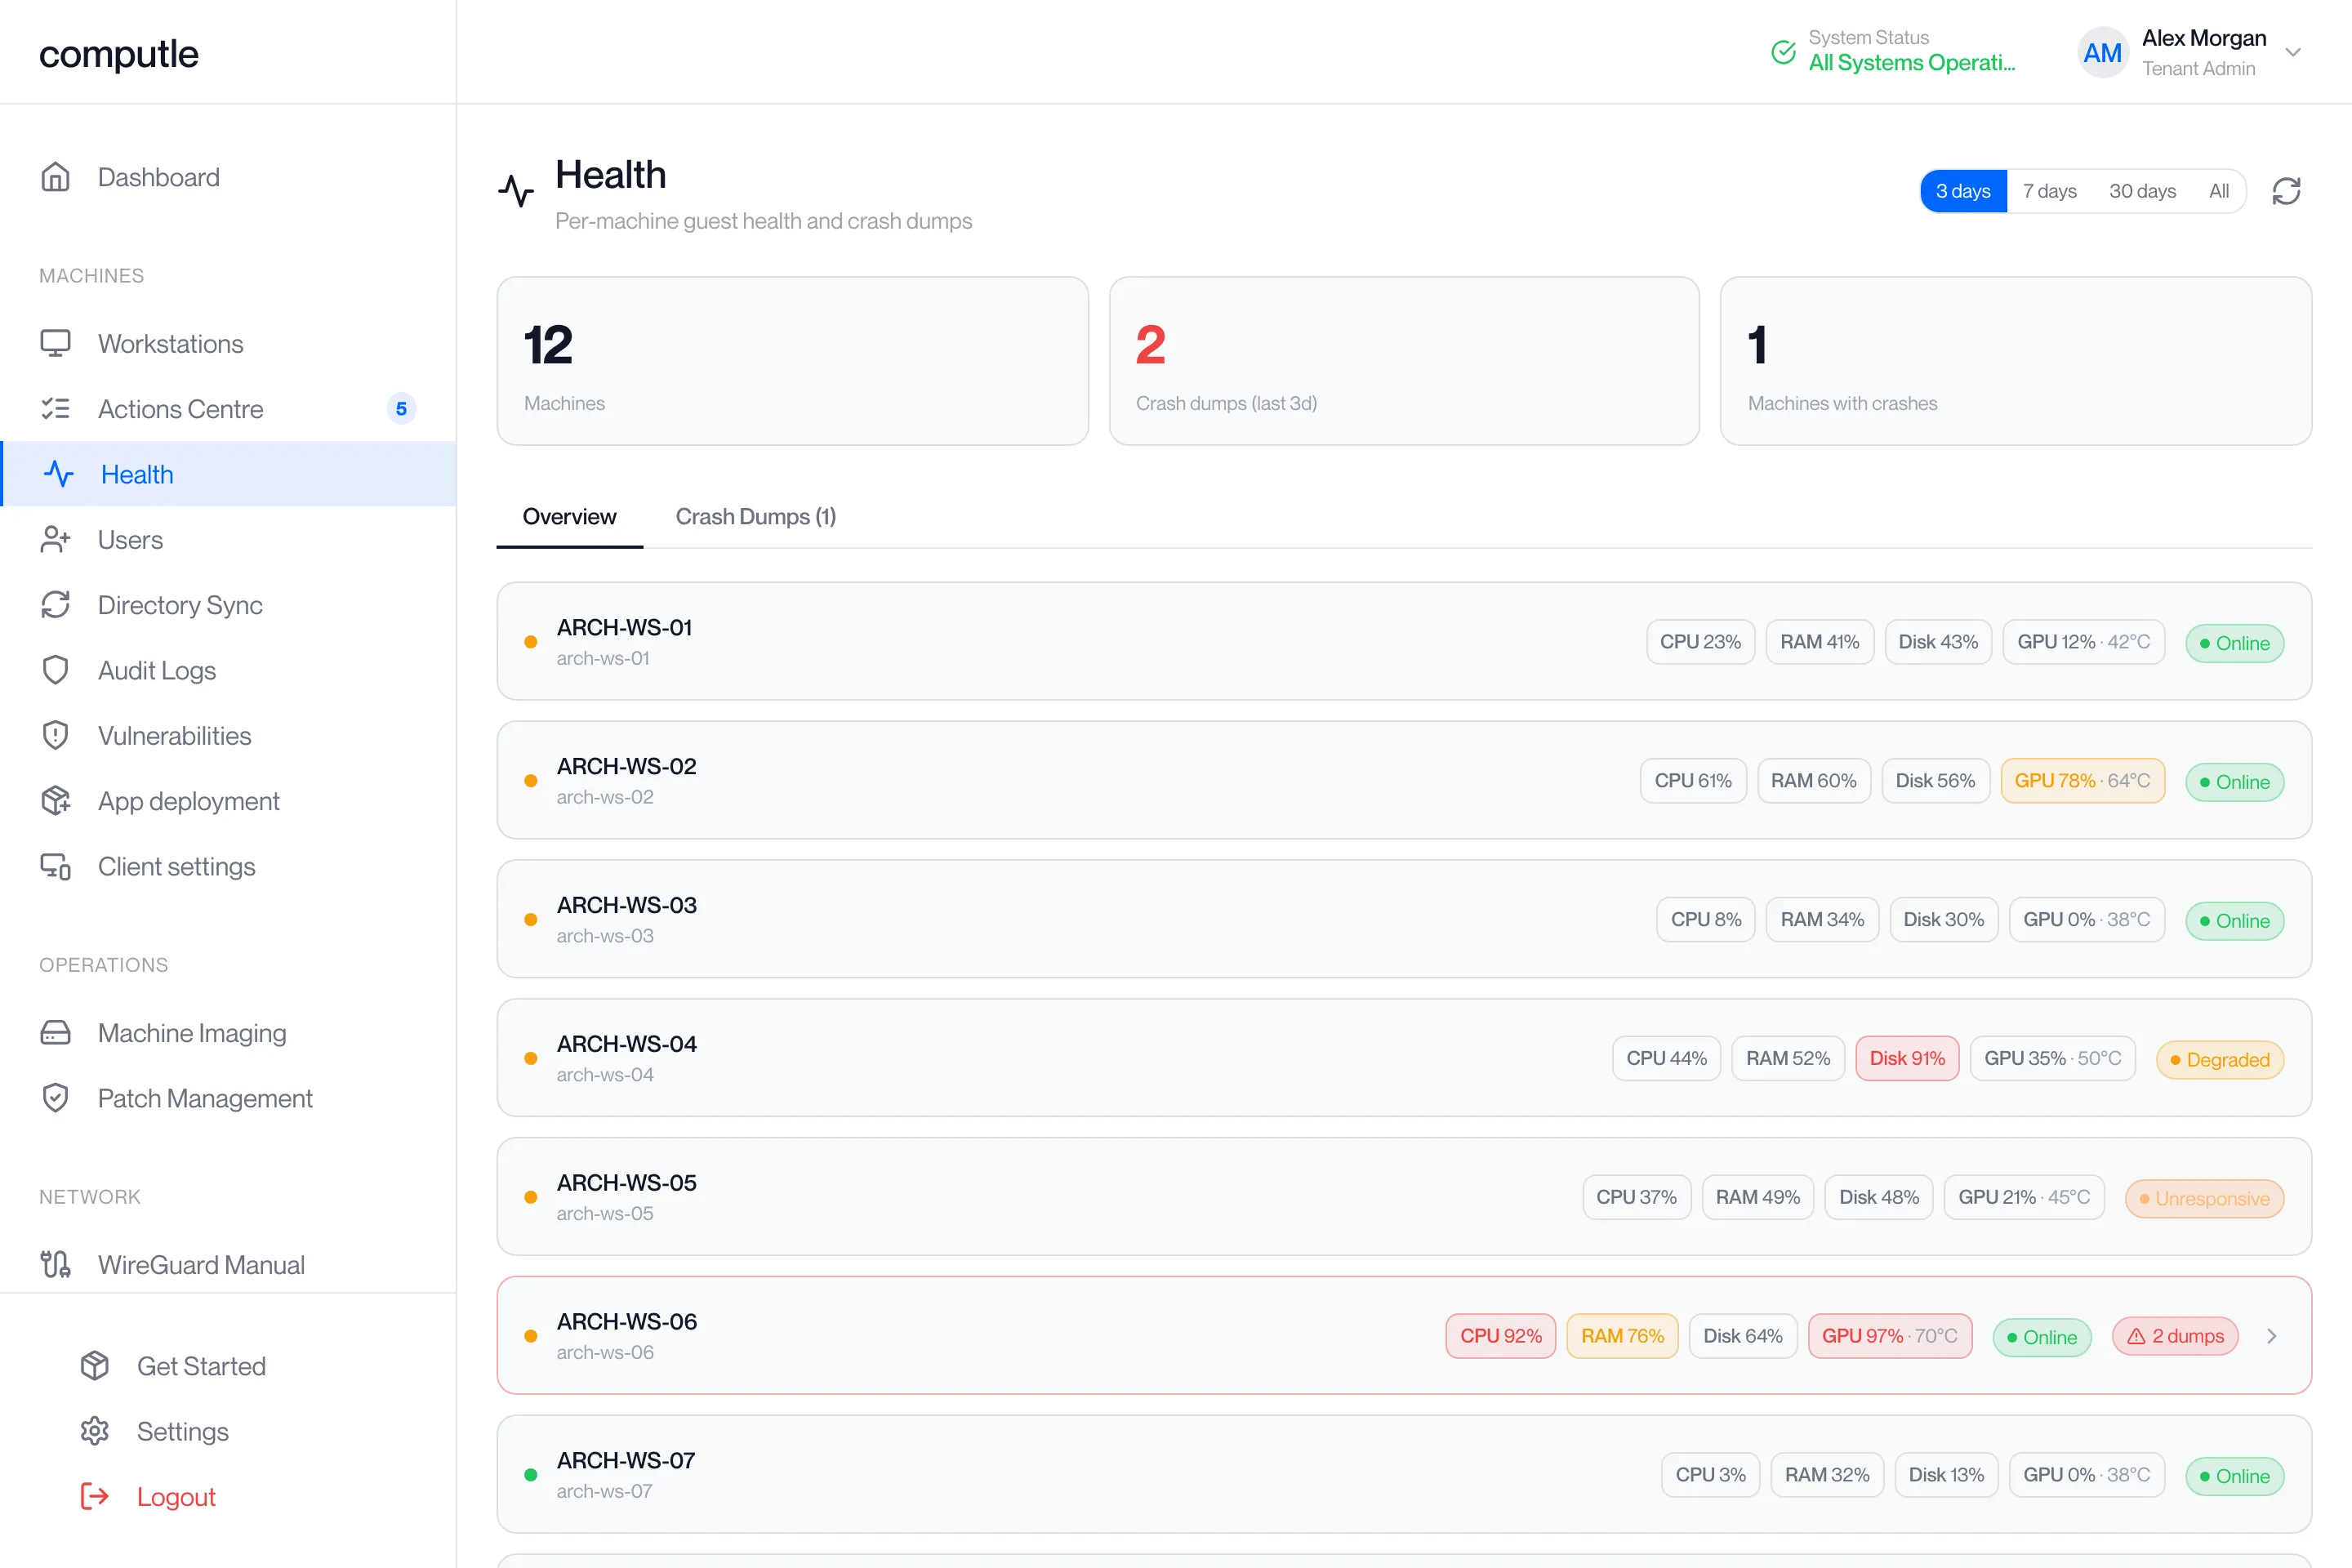
The guest health state comes from an agent that runs on each workstation and reports to Computle once a minute. If the agent is not enabled for your organisation, the page shows “Guest health agent is not enabled for this tenant — health status may be unavailable.” and every workstation reads “no agent”. Contact your account manager to have it enabled.
The page
Section titled “The page”Counters
Section titled “Counters”| Counter | What it counts |
|---|---|
| Machines | Every workstation in your organisation. |
| Crash dumps | Crash dumps received in the selected period. “N older hidden” shows how many fall outside it. |
| Machines with crashes | Workstations with at least one crash dump in the selected period. |
Period
Section titled “Period”The buttons at the top right choose the period for crash dumps: 3 days, 7 days, 30 days or All. The page opens on 3 days. The period applies to crash dumps only; health states and resource figures are always current.
Click the refresh icon to fetch the crash dump list again. Health states refresh when you reopen the page; resource figures refresh every 30 seconds.
| Tab | What it lists |
|---|---|
| Overview | Every workstation, in name order. |
| Crash Dumps | Only workstations with a crash dump in the selected period, with their dumps already expanded. The tab heading shows the count. |
Each workstation
Section titled “Each workstation”Each row shows the workstation’s status dot, its name and address, four resource tiles, its health pill, and a red “N dumps” badge when it has crash dumps.

Resource tiles
Section titled “Resource tiles”| Tile | What it shows |
|---|---|
| CPU | Processor use as a percentage. |
| RAM | Memory in use as a percentage of the total. |
| Disk | Disk space in use as a percentage of the total. |
| GPU | Graphics card use as a percentage, with the GPU temperature. |
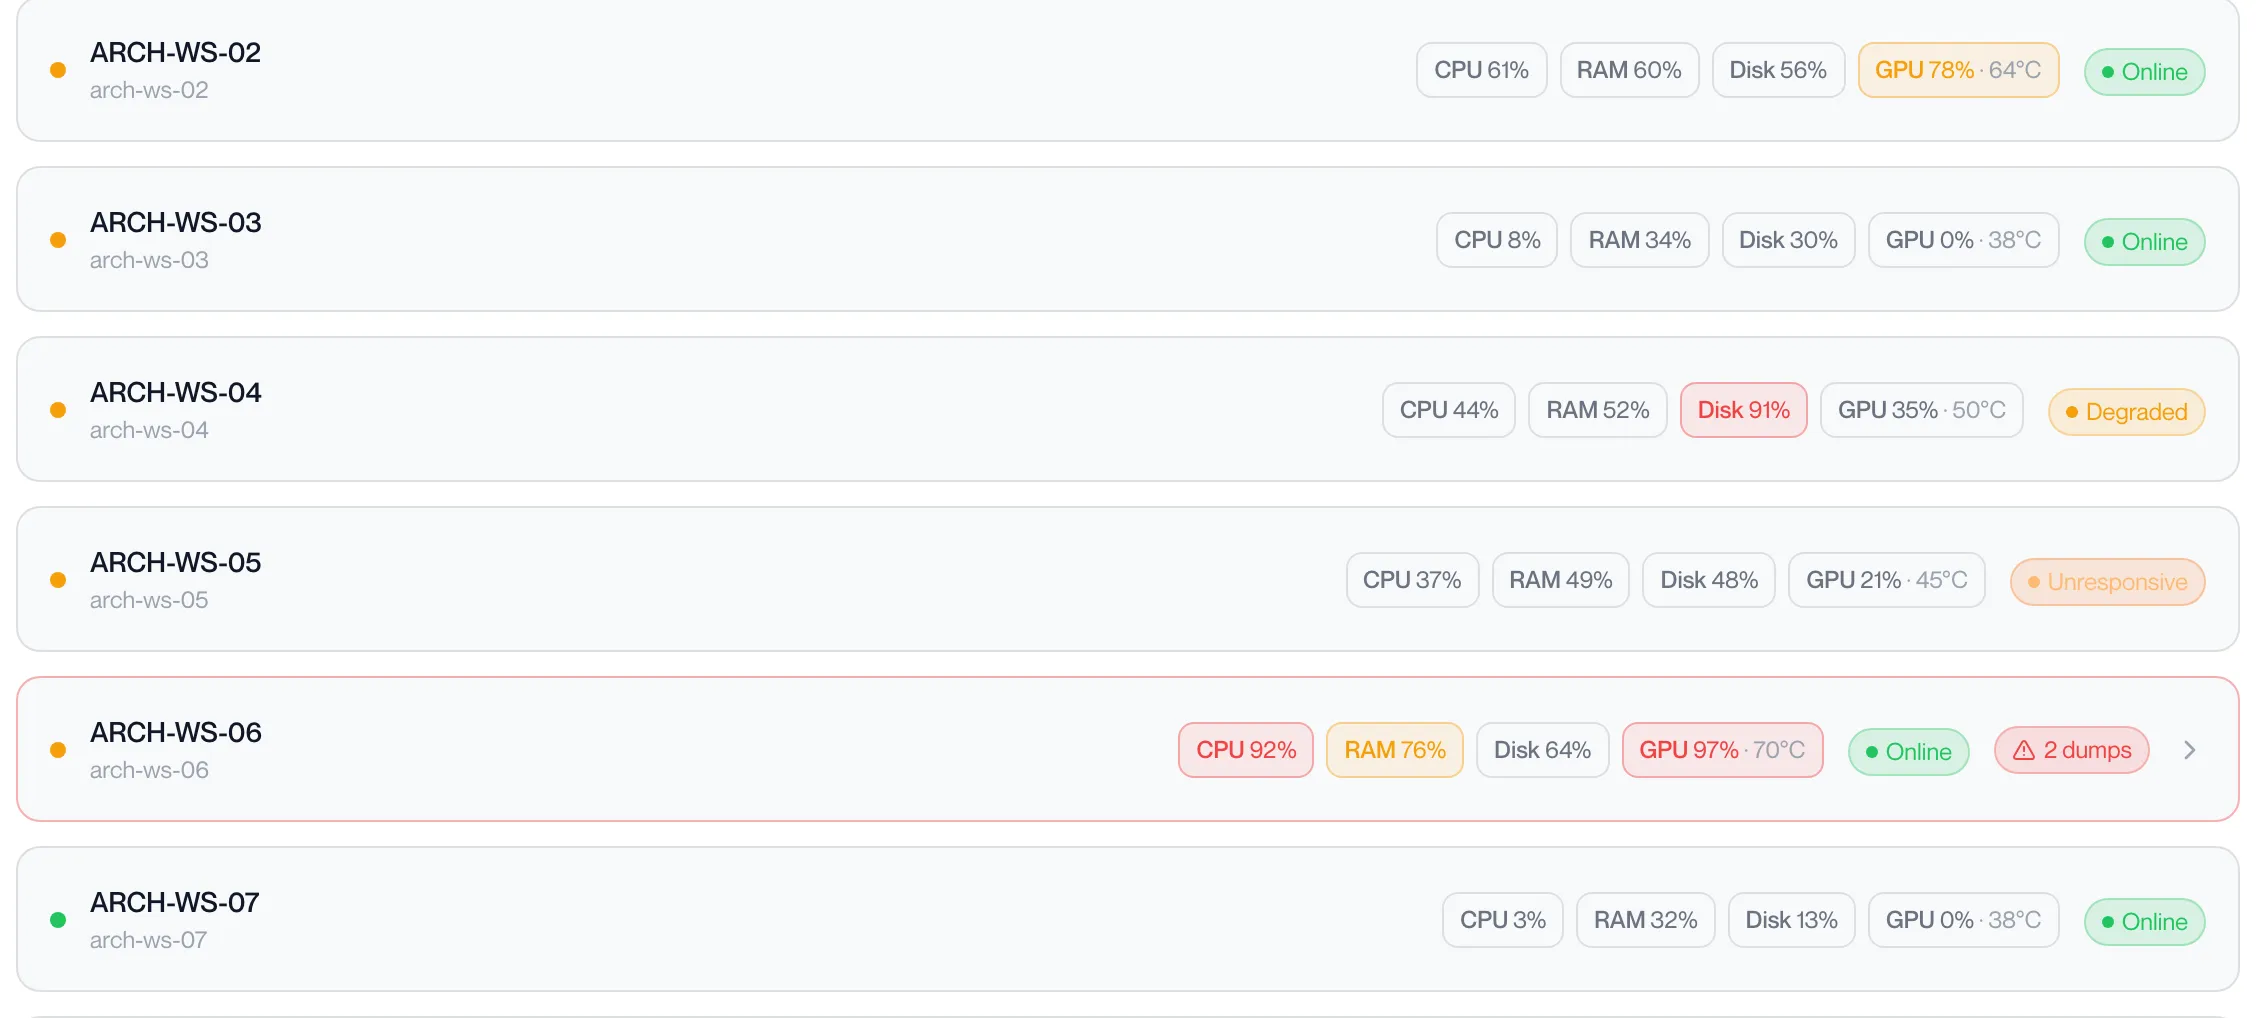
A tile turns amber at 70% and red at 90%. A dash means the workstation has not reported that figure. The tiles show only when the workstation has sent telemetry in the last ten minutes, and only on a wide screen.
Click a tile to open that workstation’s history on the Workstation Telemetry page: CPU, RAM and Disk open the System graph, GPU opens the GPU graph.
Health states
Section titled “Health states”The pill shows the workstation’s state as derived from the agent’s reports. The same pill appears in the Health column of the Workstations list. Hover over the pill for the reason, the failing checks, or the time since the last report.
| State | Colour | Meaning |
|---|---|---|
| Online | Green | The agent reported within the last three minutes and every check passed. |
| Degraded | Amber | The agent is reporting but one or more of its checks failed. The pill lists the failing checks. |
| Rebooting | Blue | The agent reported that a user restarted the workstation, and it has not reported since. |
| Patching | Purple | The agent reported that Windows Update is restarting the workstation, and it has not reported since. |
| Updating | Blue | The agent reported that an update is restarting the workstation, and it has not reported since. |
| Shut Down | Grey | The agent reported that the workstation was shutting down, and it has not reported since. |
| Unresponsive | Orange | The agent has not reported for more than three minutes and did not report a shutdown first. The pill shows “No heartbeat for Ns”. |
| Unmonitored | Grey | The agent has never reported from this workstation. |
The checks behind Degraded are connectivity checks from the workstation to the Computle services it depends on. Computle sets them; the pill names the check and the error.
A ⚠ on the pill means the workstation came back from an unclean shutdown within the last 24 hours. Hover to see “Unclean shutdown” with the reason (BSOD, unexpected shutdown, planned shutdown), the Windows bug check code where there is one, and when it was detected.
Crash dumps
Section titled “Crash dumps”A workstation with crash dumps in the selected period has a red border, a “N dumps” badge and a chevron. Click the row to expand its dumps. On the Crash Dumps tab they are already expanded.
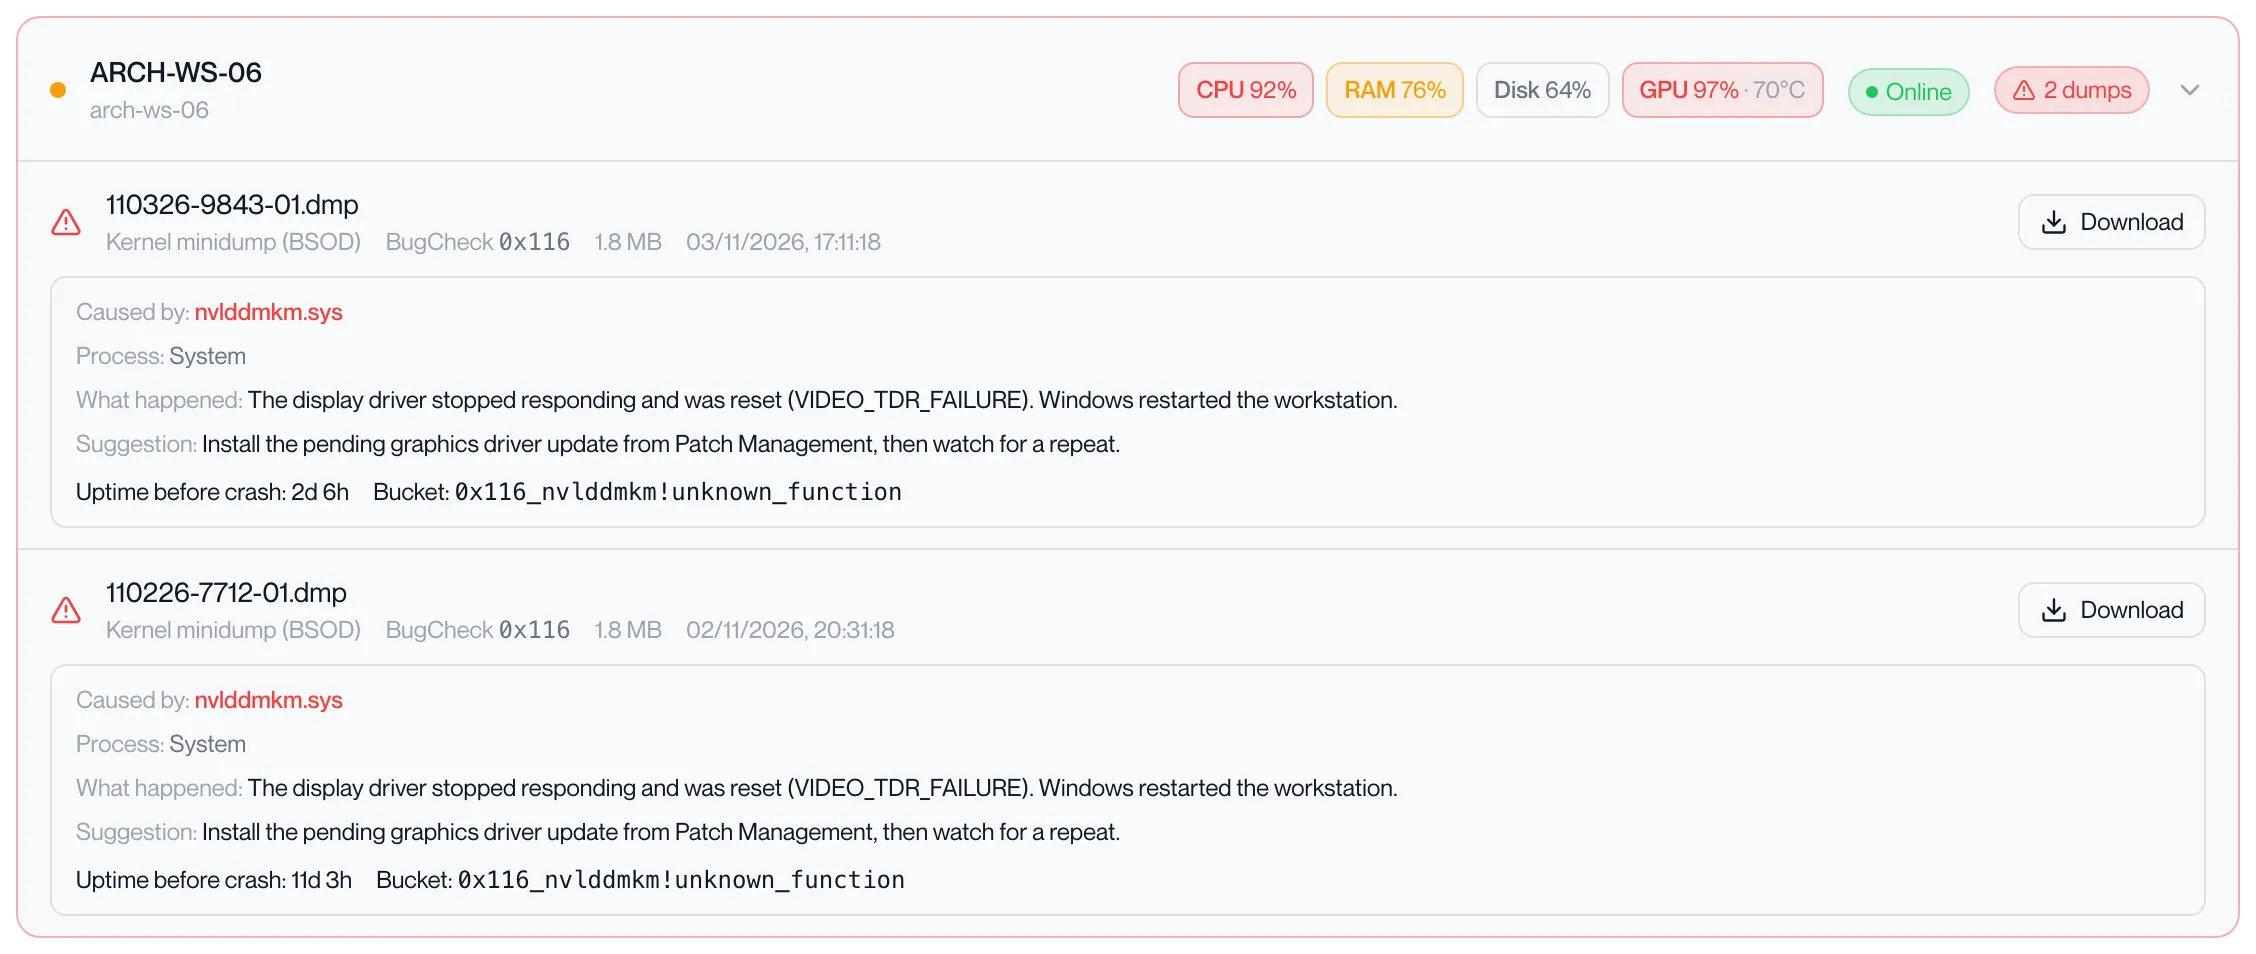
Each dump shows:
| Field | What it is |
|---|---|
| File name | The dump file as the workstation sent it. |
| Kind | Kernel minidump (BSOD), Full memory dump, Application crash, Windows Error Report, or Crash dump. |
| BugCheck | The Windows bug check code, for kernel dumps. |
| Size | The dump file size. |
| Time | When the dump was written. |
See one workstation’s crash dumps
Section titled “See one workstation’s crash dumps”-
Choose the period at the top right.
The page opens on 3 days. Choose 30 days or All for an older restart.
-
Find the workstation on the Overview tab.
A workstation with dumps in the period has a red border and a “N dumps” badge. The list is in name order.
-
Click the row.
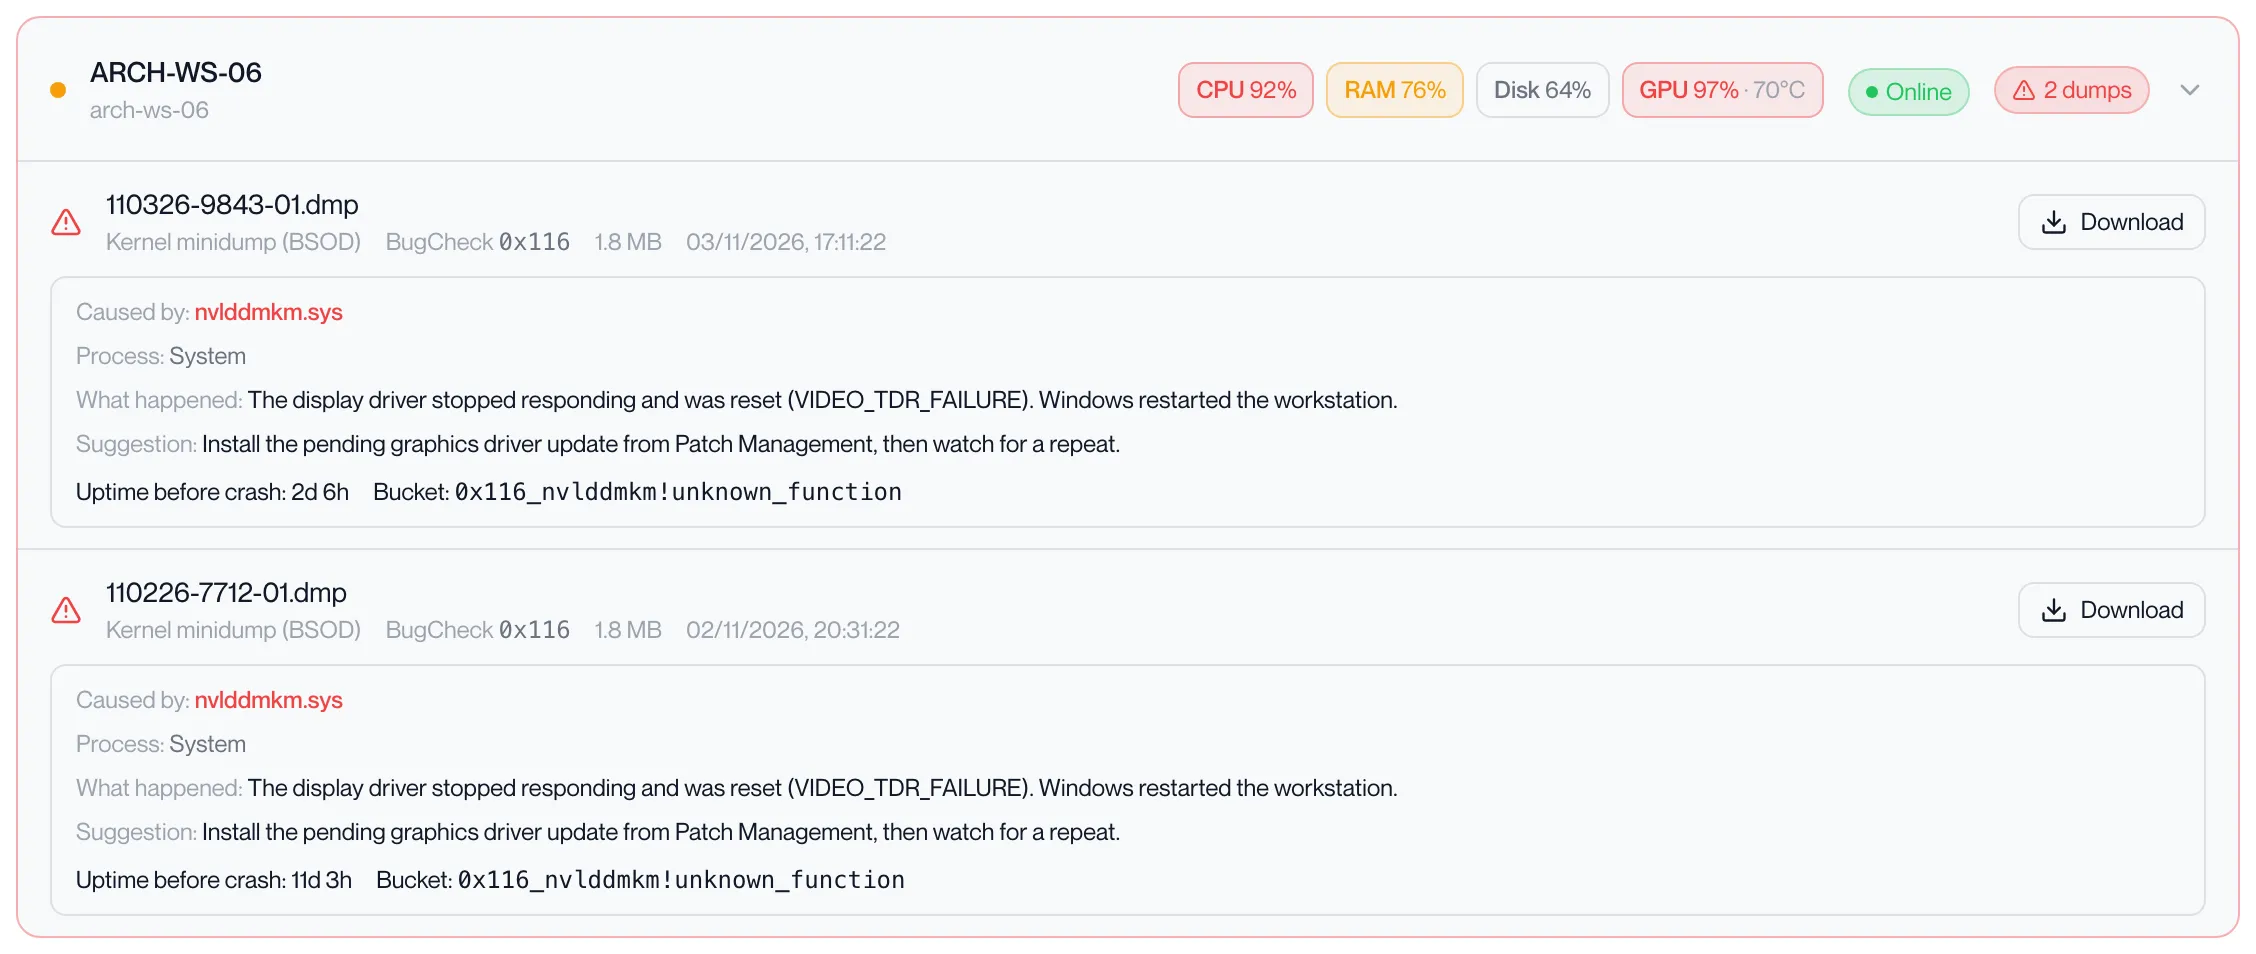
The dumps expand under it, each with its kind, bug check code, size, time and analysis. Click the row again to collapse them.
Download a crash dump
Section titled “Download a crash dump”Download a dump when Computle support asks for it, or to open it in your own debugging tools.
-
Expand the workstation’s dumps as above, or open the Crash Dumps tab.
-
Click Download on the dump.
The button shows a spinner while the link is fetched, then the browser opens the download in a new tab. The link is issued for your organisation only.
-
Save the file.
The file keeps the name shown in the list.
| Message | What to do |
|---|---|
| “No download URL returned” | The link could not be issued. Click Download again. |
| “Failed to get download link” | The portal could not reach the storage service. Try again in a minute. |
Analysis
Section titled “Analysis”Computle analyses each dump after it arrives. Under the dump you see one of:
| Shown | Meaning |
|---|---|
| Analyzing… | The analysis has not finished. |
| Analysis unavailable | The analysis did not complete for this dump. The file can still be downloaded. |
| Caused by / Process / What happened / Suggestion | The result. Caused by names the driver or module, Process the program running at the time, What happened a one-line description, and Suggestion what to try. Uptime before crash and a bucket reference may follow. |
Unattributed crash dumps
Section titled “Unattributed crash dumps”At the bottom of the Crash Dumps tab, “Unattributed crash dumps” lists dumps whose reported machine ID does not match a current workstation, for example from a workstation that has since been re-imaged. Each shows the ID it reported and can be downloaded in the same way.
Related pages
Section titled “Related pages”Questions
Section titled “Questions”A workstation shows Unresponsive but the user is working on it. Why?
Section titled “A workstation shows Unresponsive but the user is working on it. Why?”The agent on the workstation has not reported for more than three minutes. The workstation itself may be running; the agent may have stopped, or the workstation may have lost its network connection to Computle. The pill shows how long it has been silent. If it stays Unresponsive, contact your account manager.
What is the difference between Shut Down and Unresponsive?
Section titled “What is the difference between Shut Down and Unresponsive?”Shut Down means the agent reported that the workstation was shutting down before it went quiet. Unresponsive means it went quiet without reporting a shutdown.
The page says every workstation has “no agent”. What do I do?
Section titled “The page says every workstation has “no agent”. What do I do?”The guest health agent is not enabled for your organisation, or the workstations have never reported. The banner at the top of the page says which. Contact your account manager.
Why do the resource tiles show for some workstations and not others?
Section titled “Why do the resource tiles show for some workstations and not others?”The tiles show only when the workstation has sent telemetry in the last ten minutes. A workstation that is off, or that is not sending telemetry, has no tiles.
How long are crash dumps kept?
Section titled “How long are crash dumps kept?”The list shows up to the most recent 100 dumps for your organisation. Choose All in the period buttons to see every dump in the list.