Networking
Latency
This page is for the IT administrator finding out whether a slow session is the user’s own network. It covers Monitoring, Latency in the Computle Portal.
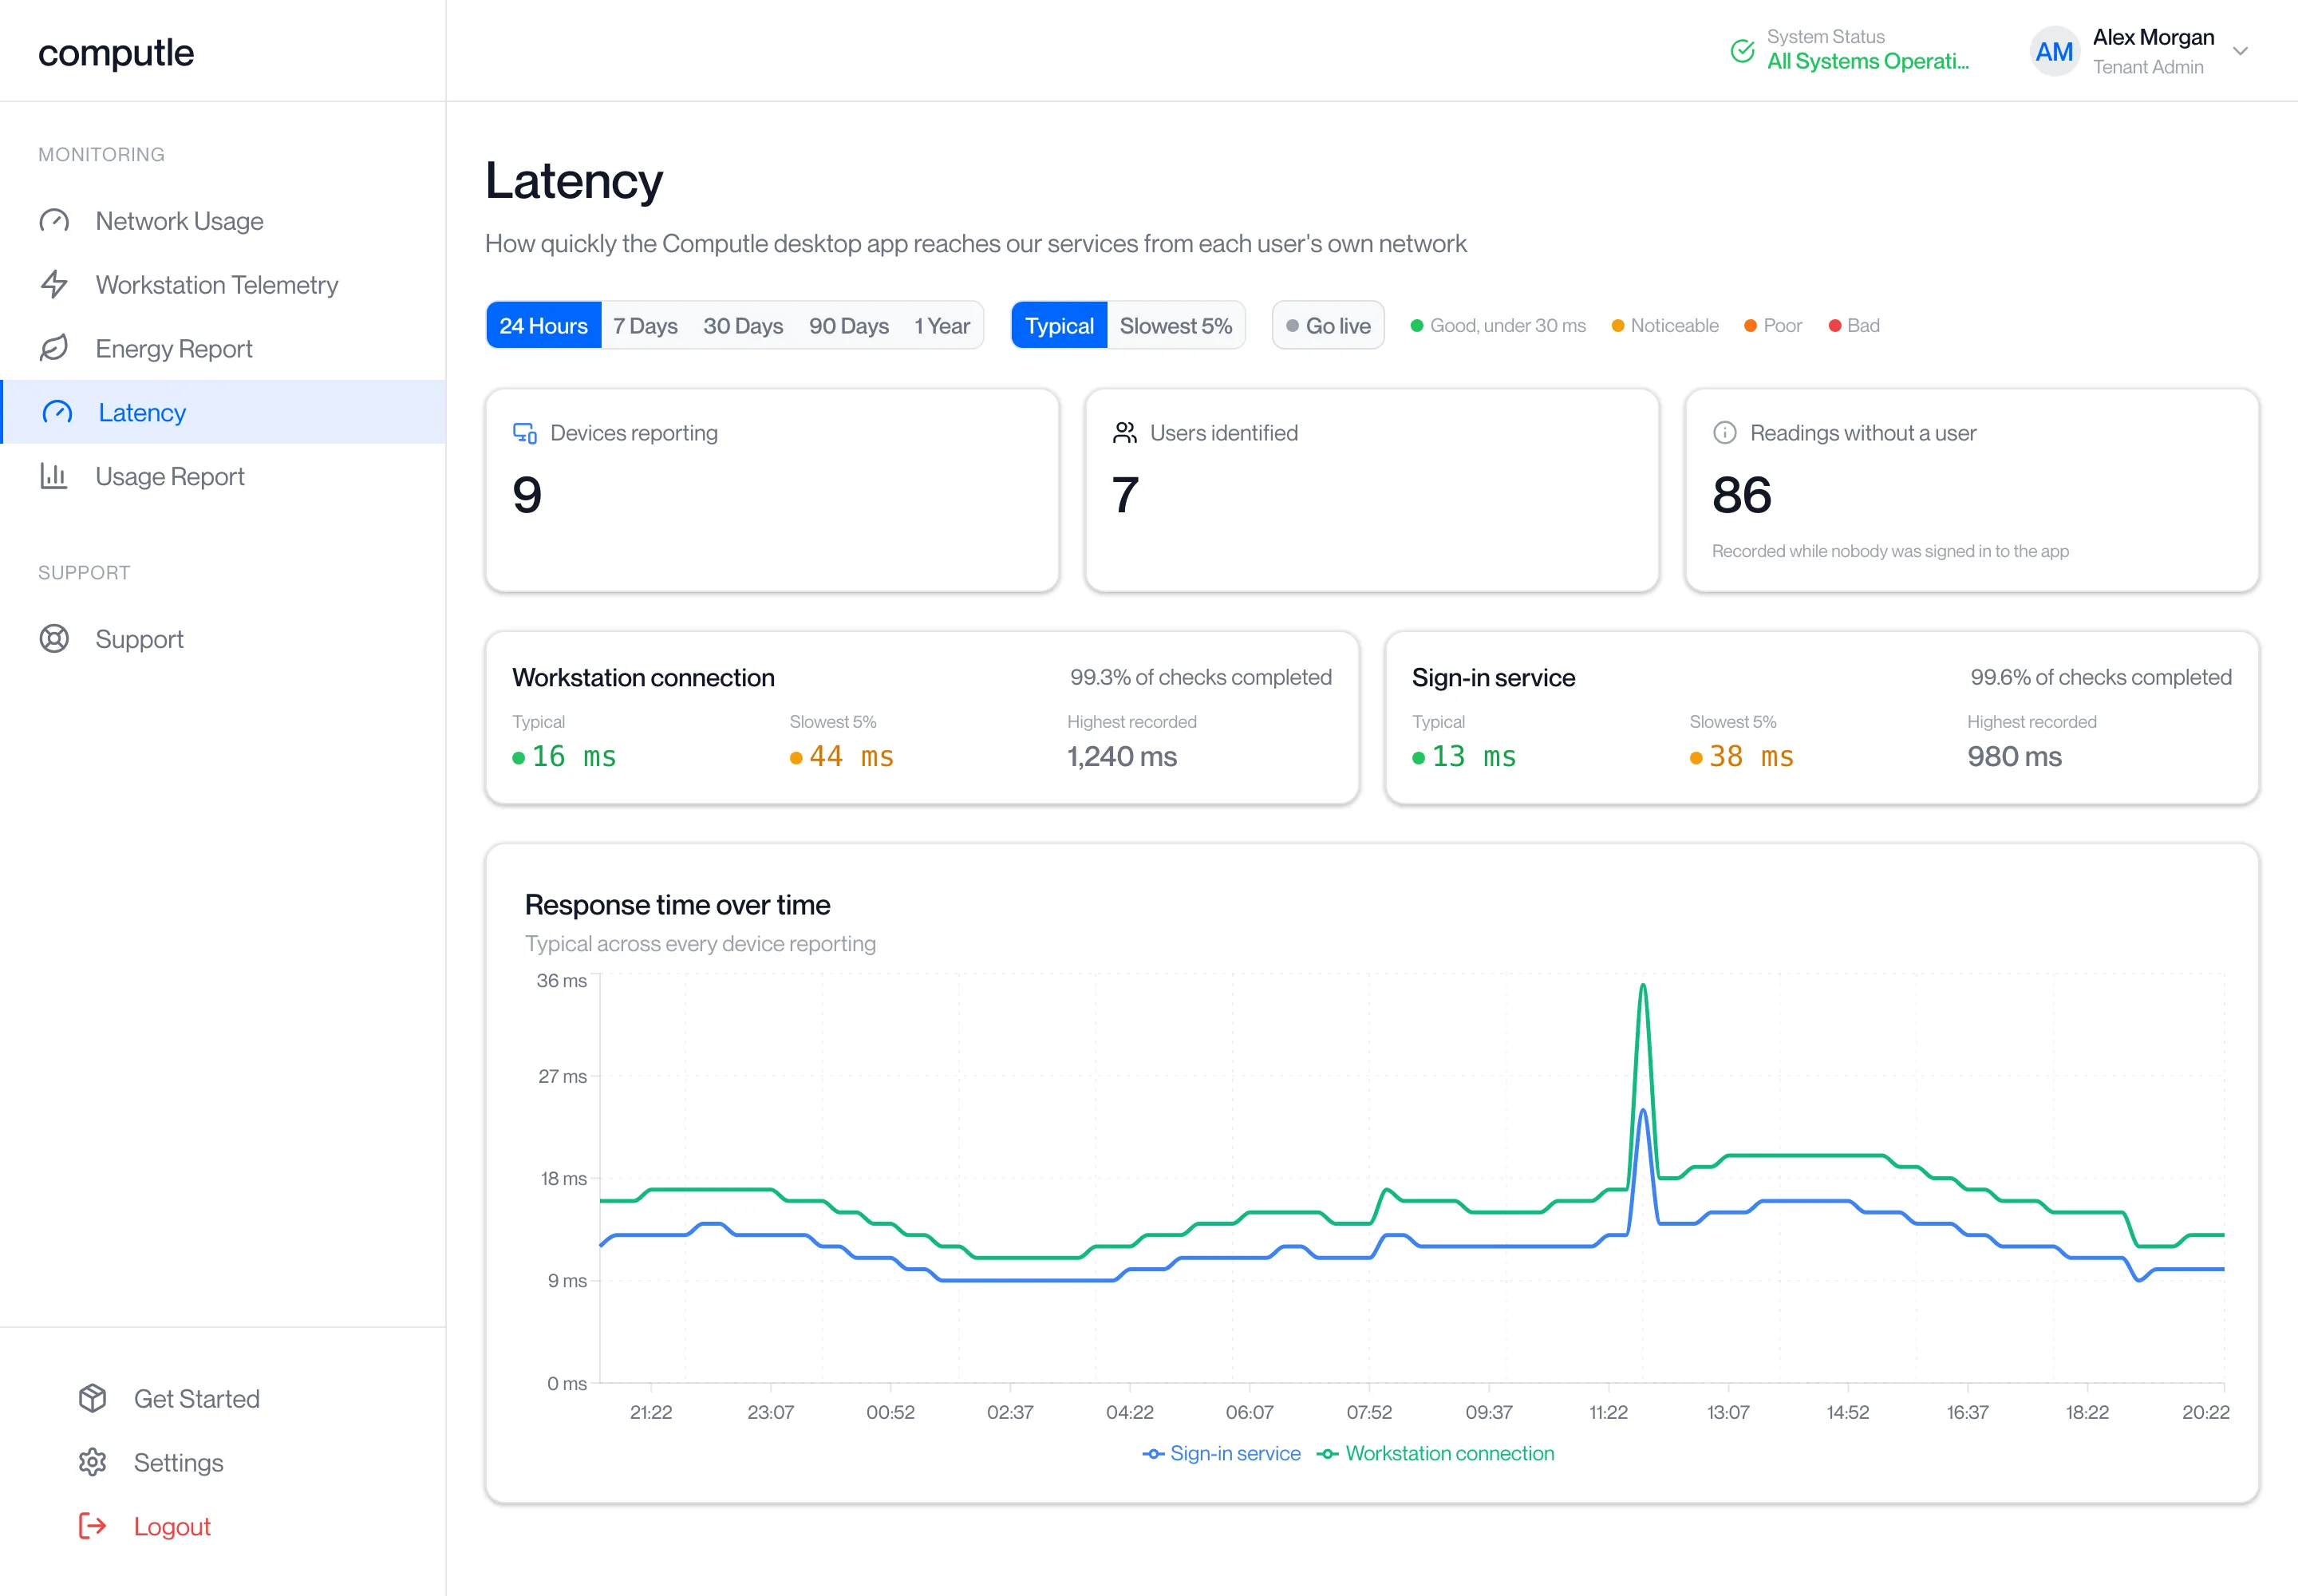
The Computle desktop app measures the time to reach two Computle services from wherever the user is, and reports every 15 minutes. The portal gathers those readings for your organisation. A reading is a round trip from the user’s device, so it includes the user’s own Wi-Fi, their internet connection and the path to Computle.
Computle switches the Monitoring pages on for your account.
What is measured
Section titled “What is measured”| Probe | What it reaches |
|---|---|
| Workstation connection | The gateway a session passes through |
| Sign-in service | The service the app signs in to |
Each reading is banded by the typical response time:
| Band | Typical response time |
|---|---|
| Good | Up to 30 ms |
| Noticeable | 31 to 60 ms |
| Poor | 61 to 100 ms |
| Bad | Over 100 ms |
30 ms is the target for a session that feels immediate.
Controls
Section titled “Controls”| Control | Options |
|---|---|
| Range | 24 Hours, 7 Days, 30 Days, 90 Days, 1 Year |
| Statistic | Typical: the median reading. Slowest 5%: the 95th percentile, the reading exceeded only one time in twenty. |
| Go live | Refreshes the page every 30 seconds and hides the range and the charts. The caption shows when the page last updated; the app itself still reports every 15 minutes. |
Percentiles are used because a laptop that sleeps during a probe records a reading of minutes, which would distort an average.
Figures
Section titled “Figures”| Figure | Meaning |
|---|---|
| Devices reporting | Devices that sent at least one reading in the range. |
| Users identified | People matched to those readings. |
| Readings without a user | Readings recorded while nobody was signed in to the app. Counted in the totals, attributed to nobody. |
Beneath them, one card per probe shows the share of checks that completed, the Typical and Slowest 5% readings with their band, and the Highest recorded.
Charts
Section titled “Charts”Response time over time plots the chosen statistic for each probe across every device reporting. Checks completed plots the share of checks that got a reply, from 80% to 100%. A period with no readings leaves a gap.
By user
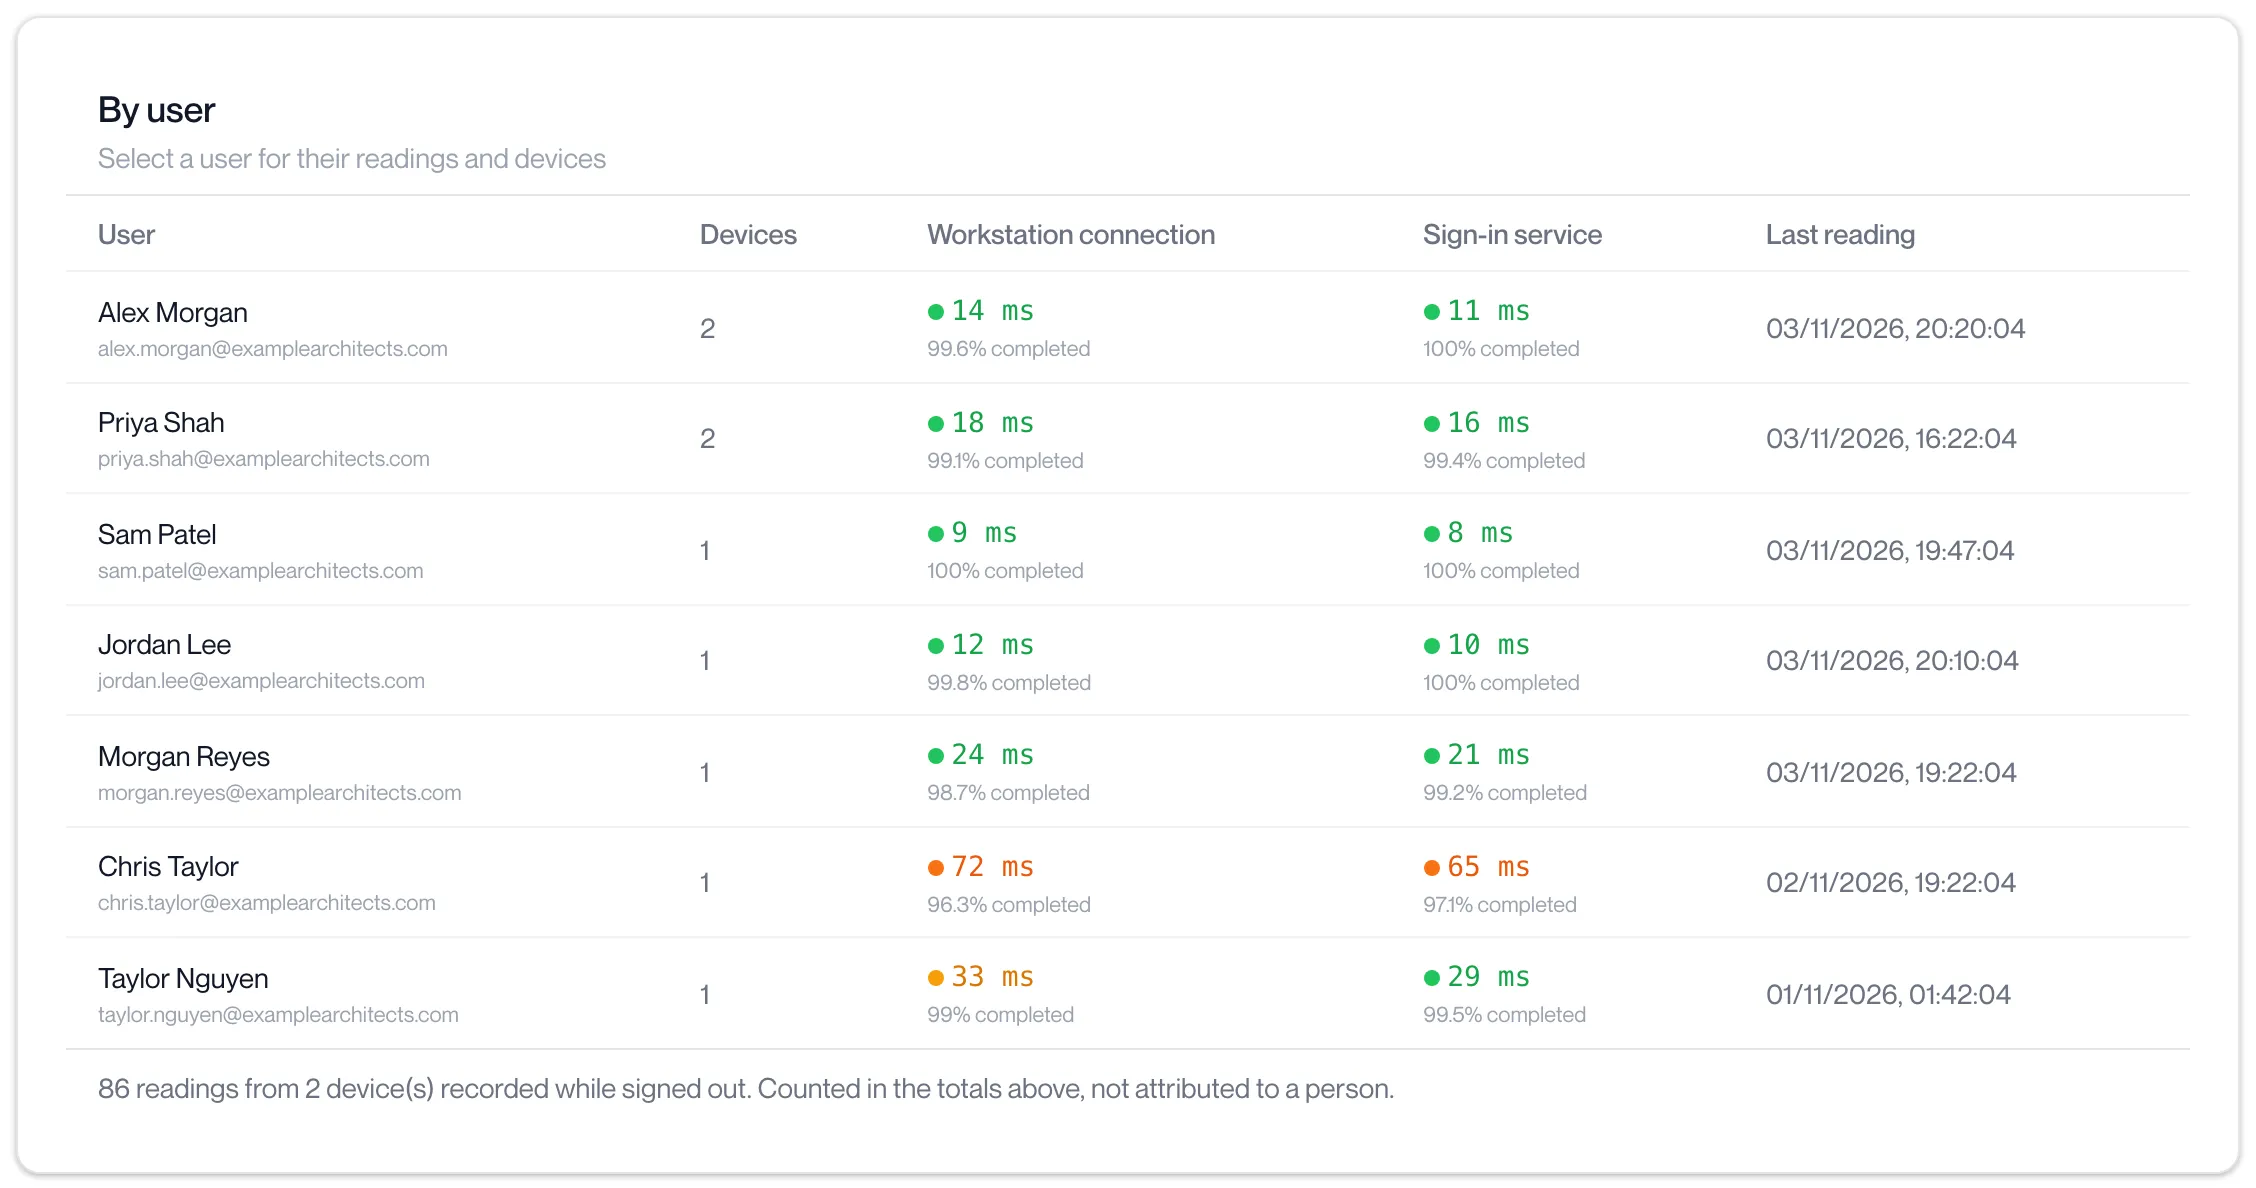
Section titled “By user”The table lists each person with their device count, each probe’s reading in the chosen statistic with its band and the share of checks completed, and the time of their last reading. A row that changes while Go live is on is highlighted briefly.
Click a row to open that person.
One person
Section titled “One person”The person’s page shows their device count and last reading, the two probe cards for their readings alone, the Response time over time chart for them, and Devices used: for each device the support code, operating system, app version, processor, memory, architecture, and when it was first and last seen.
A device that other people have also signed in to is marked “This device has also been signed in to by other people, so some of its readings belong to them.”
The person is in the page address, so the link can be shared with a colleague and the browser’s back button returns to the list.
Notes at the foot of the page
Section titled “Notes at the foot of the page”- “n readings from n device(s) recorded while signed out.” These are in the totals and in no person’s row.
- “n device(s) have been signed in to by people from more than one organisation. For those, only readings taken while one of your users was signed in are included.”
Questions
Section titled “Questions”A user reads Bad on Workstation connection. Is the workstation slow?
Section titled “A user reads Bad on Workstation connection. Is the workstation slow?”The reading is measured from the user’s device to Computle, before any workstation is involved. Start with the user’s own connection: Wi-Fi signal, other traffic on their link, and whether readings from their other devices or other users at the same location are also high.
Why does a user have no row?
Section titled “Why does a user have no row?”Readings are matched to a person when they are signed in to the app. A device used only while signed out appears under “Readings without a user”.